EDAgro_regional_analytic_extraction
🌍 Regional Monitoring API🔗
📖 Overview🔗
The Regional Monitoring API enables organizations to observe, analyze, and report on agricultural or environmental conditions across large geographic areas.
This capability is essential for businesses and institutions that need strategic insights at scale, such as crop monitoring, risk assessment, and market intelligence.
How It Works🔗
Regional monitoring leverages satellite imagery, remote sensing data, and weather analytics to provide a comprehensive view of crop and environmental conditions. Key features include:
- Tracking crop development and vegetation health across entire regions
- Analyzing soil moisture, NDVI, and crop masks to identify trends and anomalies
- Comparing multiple datasets (e.g., weather, vegetation indices) for regional benchmarking
Audiences🔗
- Crop analysts and grain originators assessing crop conditions and yield potential over large territories
- Government agencies and insurers validating production data and monitoring risks
- Market intelligence teams integrating multiple data sources for strategic planning
Why It Matters🔗
Regional monitoring provides a high-level, data-driven perspective that supports better decision-making, resource allocation, and risk management across wide areas.
🗂️ Baseline Data🔗
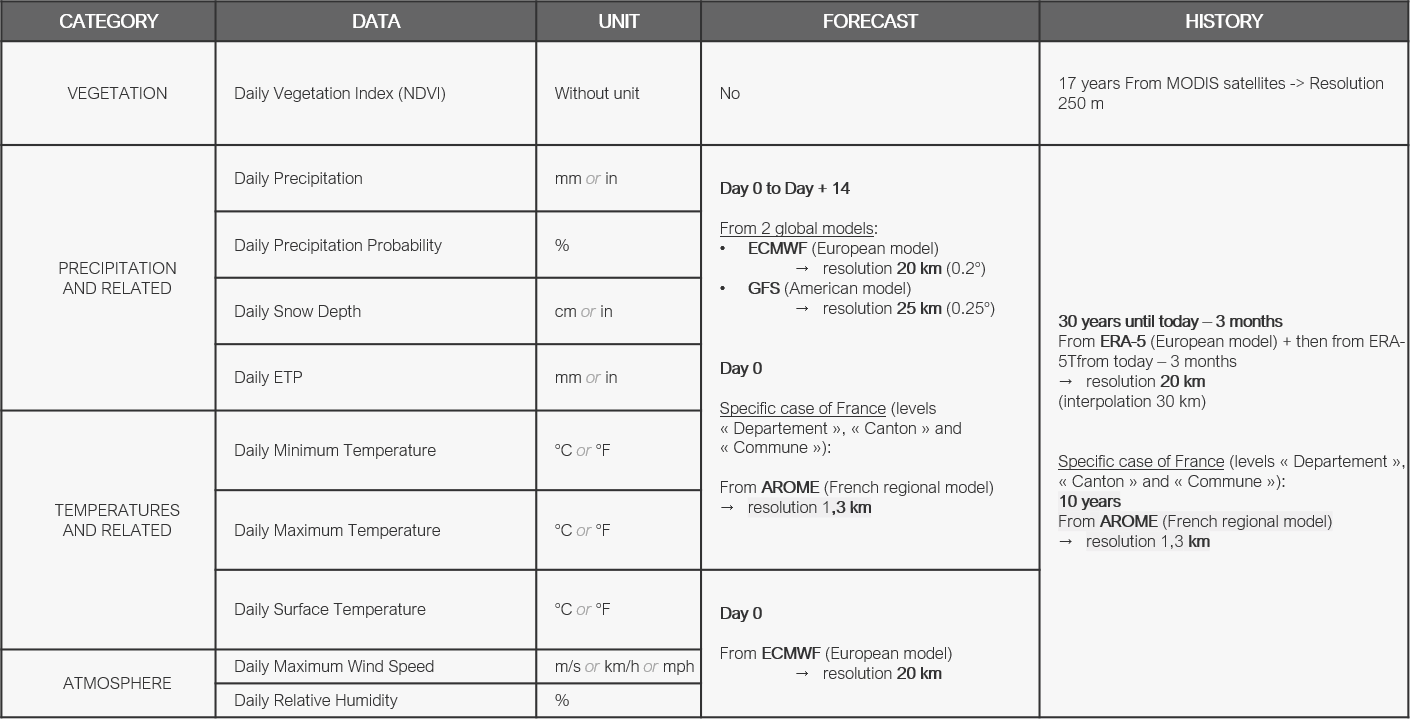
Vegetation and Weather Data🔗
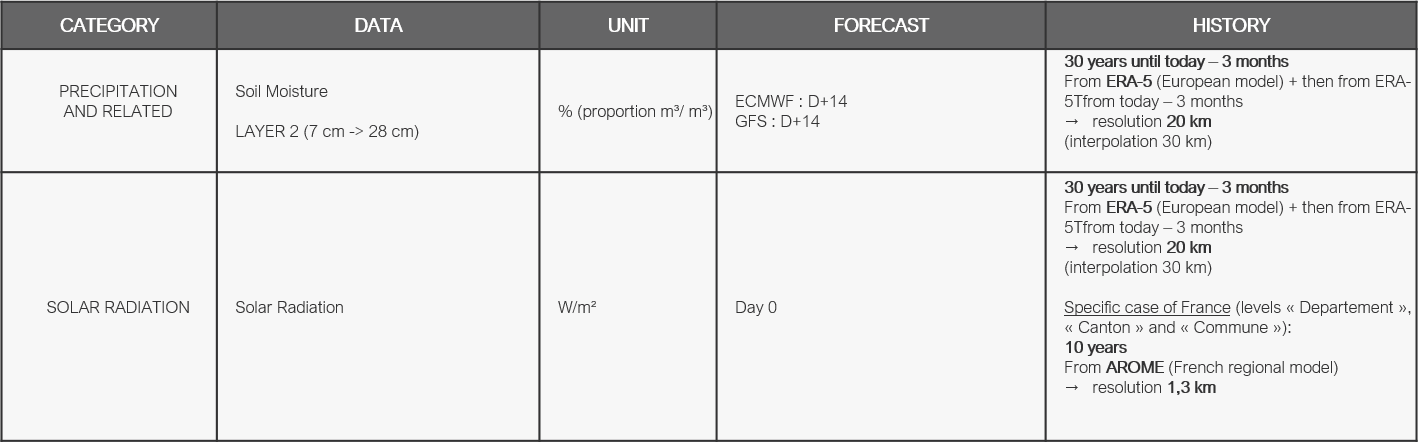
Additional Datasets🔗
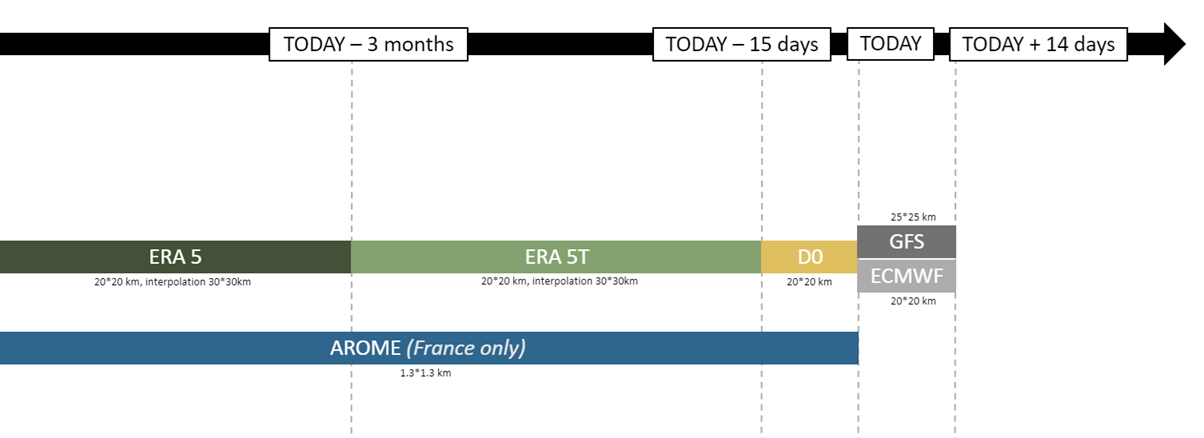
More Info on Weather Models:🔗
Forecast Weather Models🔗
- ENS model (ECMWF*, probabilistic, 20 km resolution, forecast D+14)
- GFS model (NOAA-NCEP**, deterministic, 25 km resolution, forecast D+14)
Historical Data🔗
- Historical data depth from 1990 to 2019 (today minus 15 days)
Sliding Reprocessing🔗
- D - 3 months, then D - 15 days
- ERA-5* (ECMWF) historical data integrated at the beginning of each month:
- Current Month minus 3 months data
- Example: On July 31, the last available data is April 30 (3 months delay)
- ERA-5T* (ECMWF) historical data integrated day by day at D-15 days
- ENS (ECMWF) D0 values (pseudo-analysis) stored from D0 to last ERA-5T historical available data (D-15 days)
* European Center for Weather Forecasts (ECMWF), Reading, UK
** National Oceanic and Atmospheric Administration – National Center for Environmental Prediction (USA)
*** The data assimilation system
⚙️ API🔗
Environment API root🔗
| Environment | URL |
|---|---|
| Test | [https://api-pp.geosys-na.net/Agriquest/Geosys.AgriQuest.CropMonitoring.WebApi/v0] |
| Prod | [https://api.geosys-na.net/Agriquest/Geosys.AgriQuest.CropMonitoring.WebApi/v0] |
⚙️ Parameters & Variables🔗
The Regional Monitoring API exposes weather, climate, and crop-progress indicators aggregated at the Administrative Management Unit (AMU) level. Most endpoints share a common parameter set; this section defines the building blocks once, then lists the operations available for each variable. Refer to the embedded Swagger UI above for per-endpoint payload examples and the exact response schemas.
Core Concepts🔗
| Concept | Description |
|---|---|
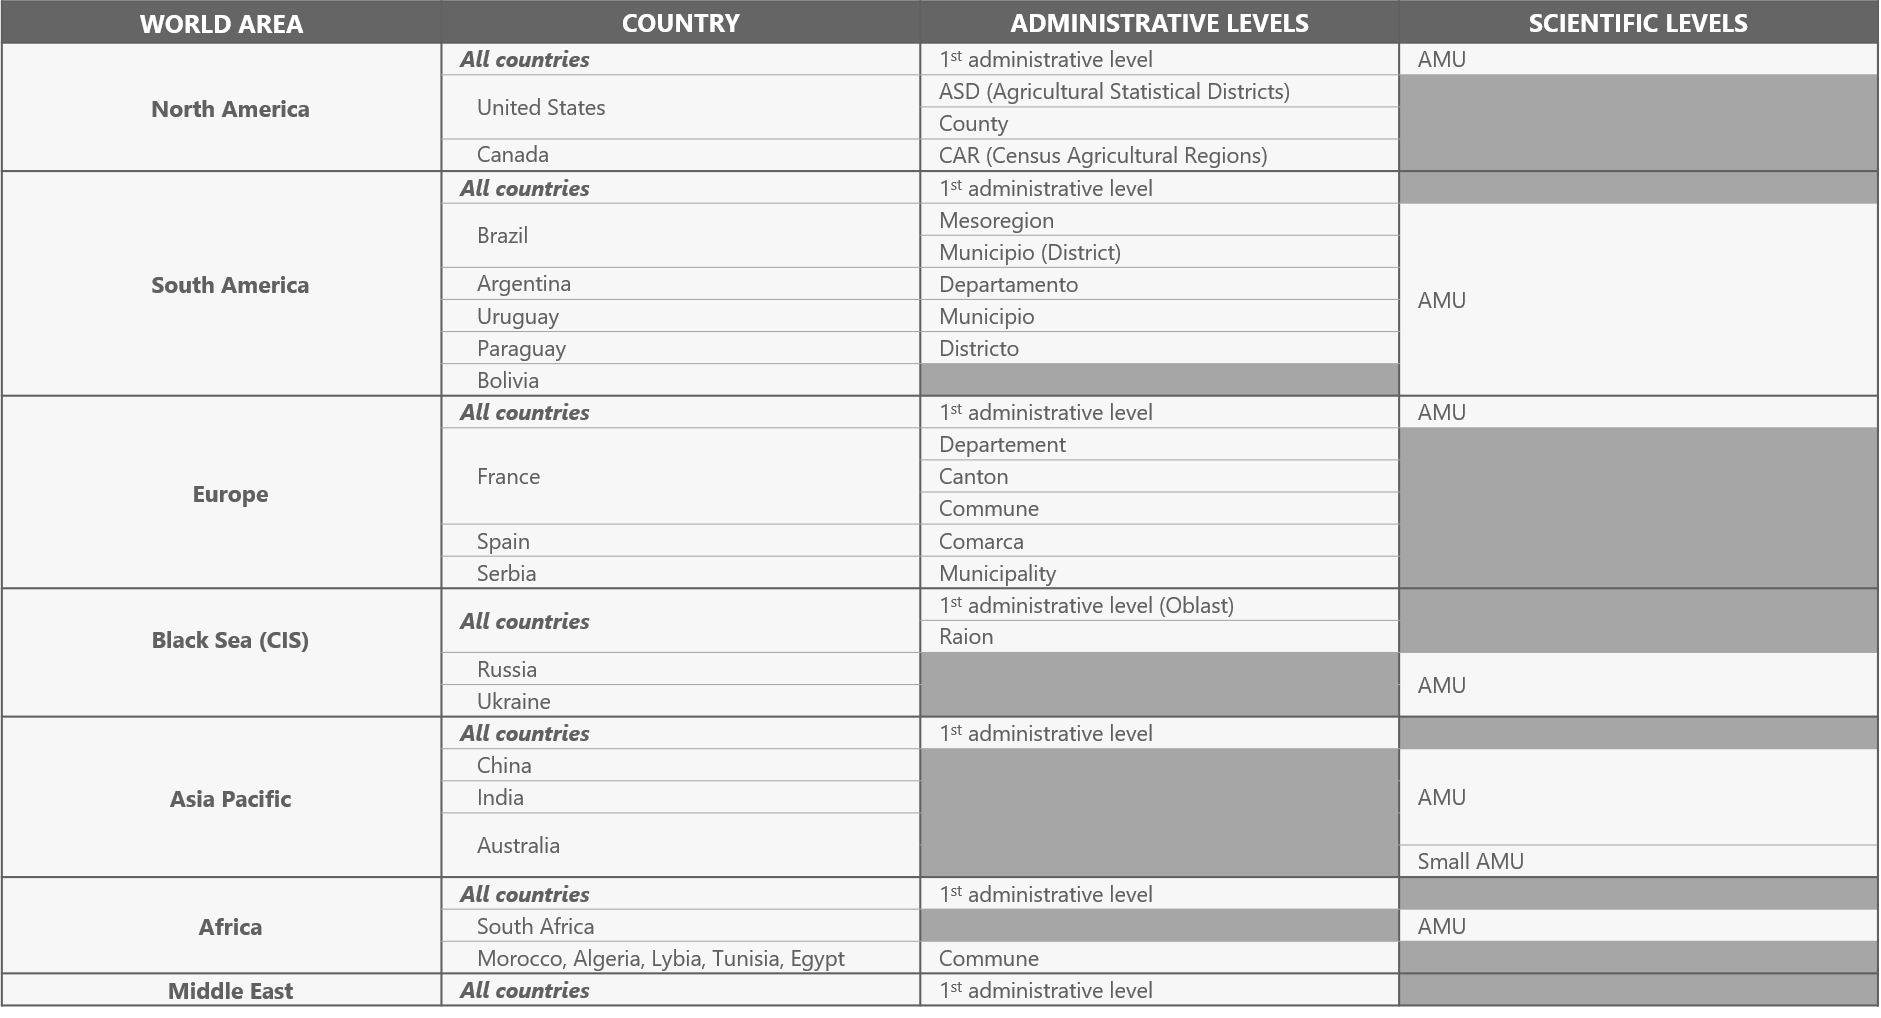
| Block | A geographic coverage area (typically a country or large region). Every query targets a single block via idBlock. Examples in active use: 267 (North America), 141 (Europe). Discover the full list available to your subscription via GET /api/customer-subscriptions/subscription-block. |
| AMU (Administrative Management Unit) | The smallest aggregation unit served by the API. Indicator values are averaged across the masked pixels of each AMU. Referenced via amuIds in POST bodies. |
| Admin Unit | A higher-level administrative grouping (e.g., state, department) that contains one or more AMUs. Filtered via adminUnitIds on GET endpoints. |
| Pixel Type | Crop mask category used in aggregation. Selected via idPixelType. See Pixel Type values below. |
| Indicator Type | Indicator computed at the pixel level (vegetation index or weather source). Selected via indicatorTypeIds. See Indicator Type values below. |
| Commodity | Crop identifier used to scope results to a specific crop (commodityId). |
Pixel Type values🔗
| ID | Name | Scope |
|---|---|---|
1 |
All vegetation | Global |
2 |
Summer crops | Global |
3 |
Winter crops | Global |
7 |
Grasslands | Global |
8 |
All crops | Global |
10 |
Corn | Global |
11 |
Soybean | Global |
301 |
Soybean | Brazil |
400 |
Corn | Europe |
401 |
Winter wheat | Europe |
402 |
Sugarbeet | Europe |
406 |
Barley | Europe |
407 |
Rapeseed | Europe |
Pixel type availability is subscription- and block-scoped. Use
GET /api/customer-subscriptions/subscription-block/pixel?blockCode={code}to list the pixel types accessible for a given block.
Info
Crop-specific pixel types (Corn, Soybean, Winter wheat, Sugarbeet, Barley, Rapeseed, and the regional variants) are generated from EarthDaily's CropID product. CropID delivers high-resolution crop identification masks, which are used here to aggregate indicator values over crop-specific pixels only — producing regional time series that reflect the targeted crop rather than generic vegetation. Generic pixel types (All vegetation, Summer crops, Winter crops, Grasslands, All crops) do not depend on CropID.
Indicator Type values🔗
| ID | Name | Source / Scope |
|---|---|---|
1 |
Vegetation Vigor Index (VVI) | All blocks |
2 |
Weather — observed | ECMWF, all blocks |
3 |
Weather — observed | AROME, France only |
4 |
Weather — forecast | ECMWF, all blocks |
5 |
Weather — forecast | GFS, all blocks |
10 |
Weather — reanalysis | ERA5-Land |
11 |
Weather — high-resolution rainfall estimates (CHIRPS) | Specific blocks |
Indicator type availability is subscription- and block-scoped. Use
GET /api/customer-subscriptions/subscription-block/indicator?blockCode={code}to list the indicator types accessible for a given block.
Common Query Parameters🔗
Used by most GET indicator endpoints (year-of-interest, comparison-*, historical-frequency). Operation-specific parameters are listed at the bottom of the table.
| Parameter | Type | Required | Description |
|---|---|---|---|
idBlock |
integer | Yes | Block identifier. |
idPixelType |
integer | Yes | Pixel type identifier (crop mask). |
indicatorTypeIds |
array[int] | Yes | One or more indicator type identifiers. |
startDate |
date-time | Yes | Start of the analysis period. |
endDate |
date-time | Yes | End of the analysis period. |
adminUnitIds |
array[int] | No | Restrict results to specific admin units. |
commodityId |
integer | No | Restrict results to a specific commodity. |
cropAreaPercentageThreshold |
float | No | Percentage threshold on the pixel type (1-pixel rule). |
cropAreaPixelThreshold |
integer | No | Absolute pixel-count threshold on the pixel type. |
numberOfYearToCompare |
integer | Conditional | Required for comparison-to-average. Number of historical years to average. |
referenceYear |
integer | Conditional | Required for comparison-to-reference-year. |
thresholdValue |
double | Conditional | Required for historical-frequency and threshold day-count endpoints. |
aboveThresholdWanted |
boolean | Conditional | true to count days above the threshold; false for below. (historical-frequency) |
numberOfConsecutiveDays |
integer | Conditional | Required for historical-frequency. Consecutive-day window. |
numberOfYearsWanted |
integer | Conditional | Required for historical-frequency. Years to look back. |
Discovery Endpoints🔗
Use these to discover the blocks, pixel types, indicator types, AMUs, and admin units available to your subscription before calling the indicator endpoints.
| Method | Path | Purpose |
|---|---|---|
| GET | /api/customer-subscriptions/subscription-block |
List blocks available to the authenticated subscription. |
| GET | /api/customer-subscriptions/location-amu/subscription-block |
Find subscription blocks by lat/lon using AMU geometry. |
| GET | /api/customer-subscriptions/location-block/subscription-block |
Find subscription blocks by lat/lon using block geometry. |
| GET | /api/customer-subscriptions/subscription-block/pixel |
List pixel types available for a block. |
| GET | /api/customer-subscriptions/subscription-block/indicator |
List indicator types available for a block. |
| GET | /api/customer-subscriptions/subscription-block/commodity-with-amu |
List commodities (with their AMU IDs) for a block. |
| GET | /api/amus |
List AMUs in a block. |
| POST | /api/amus/by-ids |
Resolve AMUs by internal IDs. |
| POST | /api/amus/by-externalids |
Resolve AMUs by external IDs. |
| GET | /api/admin-unit/poi-list/{externalID} |
Admin units associated with a list of points of interest. |
| POST | /api/admin-unit/location-by-coverage |
Find the admin unit with the highest coverage from a list of AMU IDs. |
| POST | /api/admin-unit/lasso-coverage/{blockCode} |
AMUs in a block that intersect a free-form polygon. |
| GET | /api/poi-tags/{externalID} |
Tags associated with a POI. |
| GET | /api/ultimate/fields |
Fields associated with the authenticated user. |
| GET | /api/block-last-update |
Latest weather and VVI update dates per block. |
Weather & Climate Indicators🔗
Most variables support a consistent set of operations. Find your variable in the row, then append the operation suffix to the base path. Combine with the Common Query Parameters above.
Operations:
- YOI —
GET {base}/year-of-interest— values for the selected period - CTA —
GET {base}/comparison-to-average— vs. historical N-year average - CTR —
GET {base}/comparison-to-reference-year— vs. a specific past year - HF —
GET {base}/historical-frequency— count of threshold-crossing events - Series —
POST {base}— daily/period time series for graph rendering - Graph export —
POST {base}/export-graph— CSV export of the series - Map exports —
POST {base}/export-map/{operation}— CSV export of the map (one path per supported operation)
| Variable | Base path | YOI | CTA | CTR | HF | Series | Graph export | Map exports |
|---|---|---|---|---|---|---|---|---|
| Vegetation Vigor Index (VVI) | /api/vegetation-vigor-index |
— | — | — | — | ✅ | — | — |
| Surface temperature | /api/surface-temperature |
— | — | — | — | ✅ | — | — |
| Average temperature | /api/average-temperature |
✅ | ✅ | ✅ | — | ✅ | ✅ | YOI, CTA, CTR |
| Max temperature | /api/max-temperature |
✅ | — | — | ✅ | ✅ | ✅ | YOI, HF |
| Min temperature | /api/min-temperature |
✅ | — | — | ✅ | ✅ | ✅ | YOI, HF |
| Cumulative precipitation | /api/cumulative-precipitation |
✅ | ✅ | ✅ | ✅ | ✅ | ✅ | YOI, CTA, CTR, HF |
| Daily precipitation | /api/daily-precipitation |
— | — | — | — | ✅ | ✅ | — |
| Monthly precipitation | /api/monthly-precipitation |
— | — | — | — | ✅ | ✅ | — |
| Snow depth | /api/snow-depth |
✅ | ✅ | — | ✅ | ✅ | ✅ | YOI, CTA, HF |
| Soil moisture | /api/soil-moisture |
✅ | ✅ | ✅ | — | ✅ | ✅ | YOI, CTA, CTR |
| Relative humidity | /api/relative-humidity |
✅ | — | — | — | ✅ | ✅ | YOI |
| Max wind speed | /api/max-wind-speed |
✅ | — | — | — | ✅ | ✅ | YOI |
| Solar radiation | /api/solar-radiation |
✅ | — | — | — | ✅ | ✅ | — |
| Evapotranspiration (ETP) | /api/etp |
— | — | — | — | ✅ | ✅ | — |
| Precipitation − ETP (P-ETP) | /api/p-etp |
✅ | ✅ | ✅ | — | ✅ | ✅ | YOI, CTA |
| Growing Degree Days (custom) | /api/gdd-custom-degrees |
✅ | — | — | — | ✅ | ✅ | YOI |
GDD endpoints additionally require
baseTemperature(double) andmaxTemperature(double) on every call.
Threshold-Based Day Counts🔗
Count days meeting a threshold condition over the analysis period. All require thresholdValue plus the common query parameters.
| Variable | Year-of-interest (GET) | Map export (POST) |
|---|---|---|
| Number of dry days (precipitation below threshold) | /api/number-of-dry-days/year-of-interest |
/api/number-of-dry-days/export-map |
| Number of wet days (precipitation above threshold) | /api/number-of-wet-days/year-of-interest |
/api/number-of-wet-days/export-map |
| Number of hot days (temperature above threshold) | /api/number-of-hot-days/year-of-interest |
/api/number-of-hot-days/export-map |
| Number of cold days (temperature below threshold) | /api/number-of-cold-days/year-of-interest |
/api/number-of-cold-days/export-map |
Crop Progress Statistics🔗
Deprecated
This feature is deprecated and will be removed in a future release. It is not maintained and will be removed in a future release. Please do not use.
Compare official crop progress reports against historical baselines.
| Method | Path | Purpose |
|---|---|---|
| GET | /api/statistic/crop-progress/year-of-interest |
Crop progress for a given week and growth stage. |
| GET | /api/statistic/crop-progress/comparison-to-average |
vs. N-year historical average. |
| GET | /api/statistic/crop-progress/comparison-to-reference-year |
vs. a specific past year. |
All three require:
- weekEnding (date-time),
- growthStageId (int),
- countryCode (string),
- level (int),
- commodityStatsId (int),
- statisticTypeId (int).
Comparison endpoints add nbYearsWanted (CTA) or referenceYear (CTR).
Request Body Schemas (POST endpoints)🔗
POST series, graph-export, and map-export endpoints accept structured bodies. Each body carries the same fields as the GET equivalent, encoded as JSON. The reused schemas are:
| Schema | Used by |
|---|---|
SerieRequest |
All POST {base} series endpoints. |
SerieGddRequest |
POST /api/gdd-custom-degrees (adds baseTemperature, maxTemperature). |
ExportGraphDataSerieRequest |
All POST {base}/export-graph endpoints. |
ExportGddGraphDataSerieRequest |
POST /api/gdd-custom-degrees/export-graph. |
AmuDurationWeatherRequest |
POST {base}/export-map/year-of-interest. |
AmuComparisonWeatherRequest |
POST {base}/export-map/comparison-to-average. |
AmuReferenceYearWeatherRequest |
POST {base}/export-map/comparison-to-reference-year. |
AmuHistoricalFrequencyWeatherRequest |
POST {base}/export-map/historical-frequency. |
AmuThresholdWeatherRequest |
POST /api/number-of-*-days/export-map. |
AmuGddWeatherRequest |
POST /api/gdd-custom-degrees/export-map. |
See the embedded Swagger UI for the full field-by-field schema and example payloads.
Example SerieRequest payload (used for POST {base} series endpoints):
{
  "amuIds": [123456],
  "idBlock": 267,
  "idPixelType": 8,
  "indicatorTypeIds": [1],
  "startDate": "2025-01-01",
  "endDate": "2025-12-31",
  "fillYearGaps": false
}
Where:
amuIds— list of AMUs to extract (resolved via the Discovery Endpoints above).idBlock,idPixelType,indicatorTypeIds— see Core Concepts.fillYearGaps— whentrue, the API back-fills missing dates within the requested period using historical climatology.
Response Shapes🔗
| Schema | Returned by | Notes |
|---|---|---|
AmuResponse |
GET aggregation endpoints (year-of-interest, comparison-*, historical-frequency) |
AMU-keyed indicator values. |
SerieData |
POST series endpoints | Time-indexed values for graph rendering. |
AdminUnitResponse |
Crop progress statistics | Admin-unit-keyed values. |
Array of BlockData / BlockAggregateData |
Block discovery | Block metadata. |
Array of AmuDataWithGroup |
AMU lookups | AMU metadata with grouping. |
Array of AdminUnitData / AdminUnitTreeData |
Admin unit lookups | Hierarchy of admin units. |
Array of PixelTypeData / IndicatorTypeData / CommodityAmuData |
Subscription discovery | Subscription-scoped metadata. |
| Array of string arrays | All export-* endpoints |
CSV rows for direct download. |
⚠️ Error management🔗
| Status Code | Error Type | Description | Example Response |
|---|---|---|---|
| 400 | Bad Request | Invalid or missing query/body parameters. | {"detail": "Block identifier is required."} |
| 401 | Not Authenticated | Missing or invalid OAuth 2.0 token. | {"detail": "Not authenticated"} |
| 403 | Forbidden | Token is valid but the subscription does not grant access to the requested block, AMU, or indicator. | {"detail": "Subscription does not include this block."} |
| 422 | Validation Error | Request body failed schema validation. | {"detail": [{"loc": ["body","request","startDate"], "msg": "field required", "type": "value_error.missing"}]} |
| 500 | Internal Server Error | Unexpected error during indicator computation. | {"detail": "Error while computing indicator values."} |
📊 Performance and Accuracy🔗
Coverage🔗
The Regional Monitoring service provides global / worldwide coverage for vegetation and weather indicators. Crop-specific outputs are regionalized and cover most commodity crops out of the box — see the Pixel Type values table for the catalog currently delivered (corn, soybean, winter wheat, barley, rapeseed, sugarbeet, with global and regional variants for Europe and Brazil).
Additional crop masks can be added on demand through the CropID product, which is the source of all crop-specific pixel types exposed here.
Aggregation🔗
💼 Use Case and Product Integration🔗
This analytic is used in: