Read the analysis legend🔗
The map legend has two parts: a direction symbol above the color bar identifies the viewing geometry or deformation component, and the color bar shows how the selected field's values map to colors.
Line of sight analyses🔗
Ascending and descending analyses show deformation along the satellite's line of sight. Their legends use diagonal viewing-direction symbols. Sentinel-1 is right-looking, and the symbol distinguishes the viewing geometry of the two orbit directions.
| Legend | Analysis | Meaning |
|---|---|---|
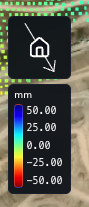 |
Ascending LOS | The diagonal arrow runs from the upper left toward the lower right. This symbol identifies the ascending viewing geometry and corresponds to an A analysis. |
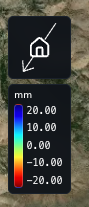 |
Descending LOS | The diagonal arrow runs from the upper right toward the lower left. This symbol identifies the descending viewing geometry and corresponds to a D analysis. |
LOS deformation measures movement along that viewing direction. It can contain horizontal and vertical contributions; use an east–west–vertical analysis to examine the separate components.
East west and vertical components🔗
An EWZ analysis combines ascending and descending observations to resolve east–west and vertical deformation. The symbol changes with the component displayed.
| Legend | Component | Meaning |
|---|---|---|
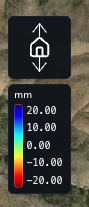 |
Vertical | The vertical arrow identifies the up–down component of deformation. |
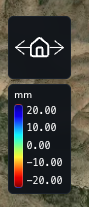 |
East–west | The horizontal arrow identifies the east–west component of deformation. |
East–west sign convention: Negative values represent westward movement; positive values represent eastward movement.
Read the color bar🔗
Read each color against its numeric value and the units printed above the bar. In these examples, mm means millimeters of deformation. The direction symbol identifies the viewing geometry or component; use the numeric scale to interpret the colored data.
The scale depends on the selected field and Colorscale Range. Changing the colormap or Invert changes the relationship between colors and values, so check the legend after making adjustments. See Change the map appearance for these controls.