Select a site and analysis🔗
Start in Iris 2.0 by choosing a site and the analysis you want to explore. You can browse demo sites or your own sites, then open the latest analysis or select an earlier analysis period.
Find a site🔗
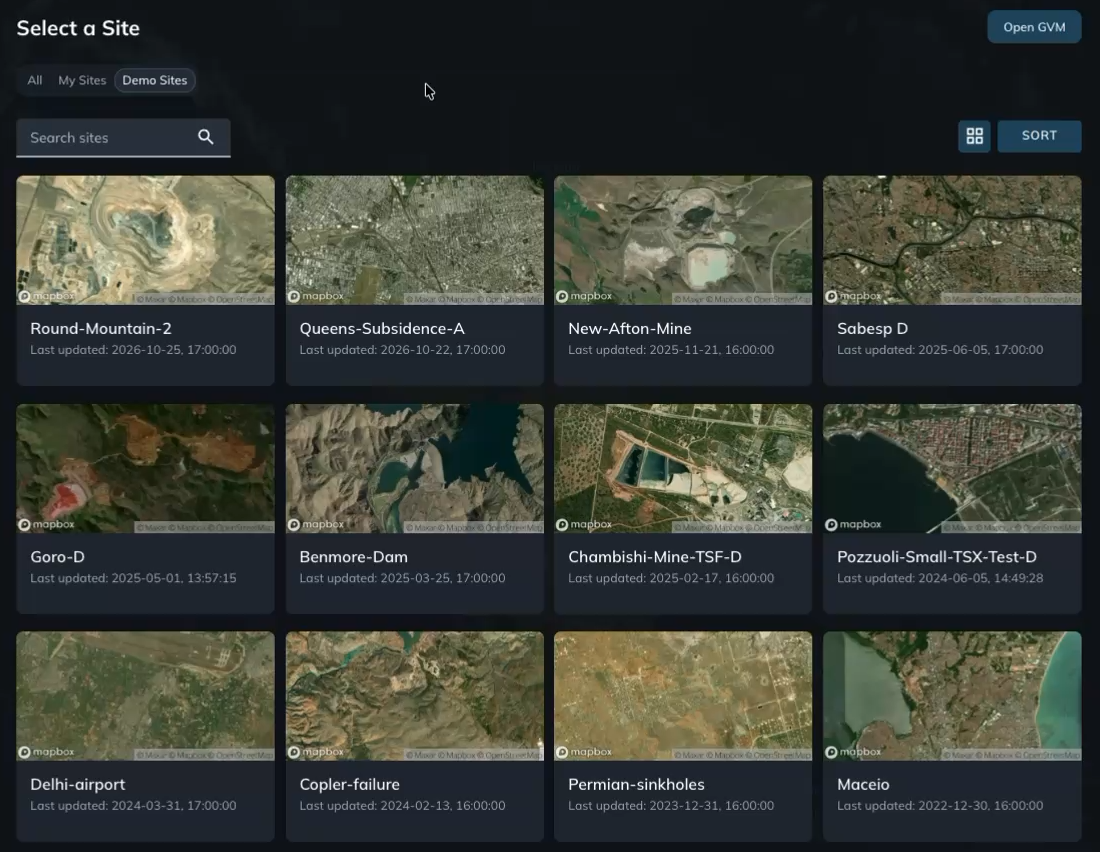
- On the Select a Site screen, choose Demo Sites to explore sample sites, or My Sites to browse your own sites.
- Browse the site cards, or enter a site name in Search sites.
- Click a site to see its available analyses.
Choose an analysis type🔗
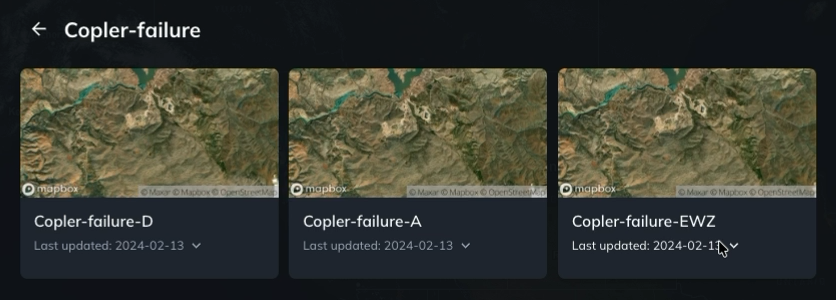
A site can have analyses from ascending observations, descending observations, or a combination of both. The suffix in each analysis name identifies its type.
| Suffix | Analysis type | Description |
|---|---|---|
| D | Descending | Uses satellite observations from descending passes. |
| A | Ascending | Uses satellite observations from ascending passes. |
| EWZ | East–west and vertical | Combines ascending and descending observations using their viewing geometry to calculate east–west and vertical deformation components. |
For example, Copler-failure-D, Copler-failure-A, and Copler-failure-EWZ are different analysis types for the same site.
Once an analysis opens, its map legend identifies the viewing geometry or deformation component being displayed.
Choose an analysis period🔗
Iris selects the most recent analysis by default. Click the analysis card to open it.
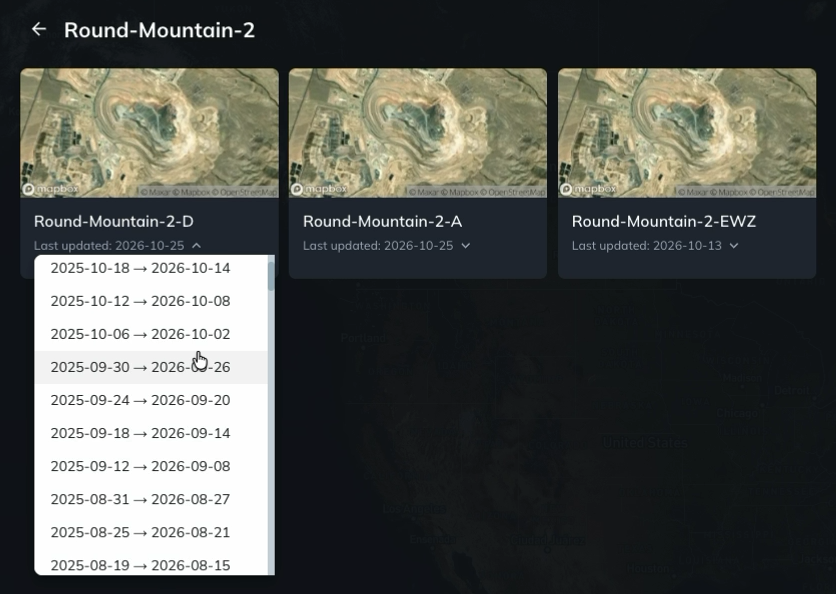
To open a different analysis when multiple periods are available:
- Click the dropdown arrow beside Last updated on the analysis card.
- Select the analysis period you want to open. Each option shows its start and end dates.
Analyses typically cover a one-year window. This captures longer-term deformation trends and provides enough observations to support measurements with high confidence.
Once the analysis opens, change the map appearance to choose a basemap and adjust the data opacity and colors.