Choose a deformation field🔗
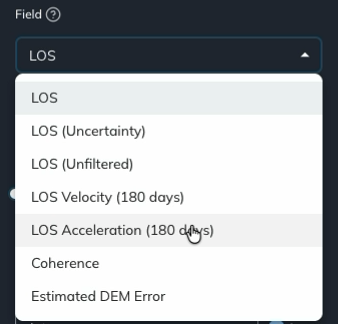
Use the Field dropdown to choose the measurement displayed on the map. For ascending and descending analyses, you can view line-of-sight deformation, examine its uncertainty, or measure movement relative to a reference point you choose.
Select a field🔗
- Open a site and analysis and wait for the data to load.
- Open Field in the Analysis panel on the left.
- Select the field you want to view and allow the display to update.
Check the map legend and chart axis labels after switching fields, because the quantity being displayed changes.
The direction symbol above the color bar identifies the LOS viewing geometry or the east–west or vertical component of an EWZ analysis.
LOS🔗
LOS means line of sight: deformation measured along the satellite's viewing direction.
The LOS field uses spatial filtering to highlight local deformation. At each epoch, Iris fits a broad spatial trend to the data and subtracts it. The resulting deformation is relative to the surrounding deformation rather than to a single reference point you select.
Spatial filtering can also remove broad deformation signals. To investigate movement relative to a known location, use LOS (Unfiltered). See Spatial Filtering in Iris for the processing explanation.
To focus the map on deformation of interest, set the color range and hide smaller movements with a mask threshold.
LOS Uncertainty🔗
Select LOS (Uncertainty) to display the estimated error associated with each point. Use this field to assess the deformation relative to its uncertainty.
In POINT mode, select a map location to inspect how its uncertainty changes through the analysis period. The vertical axis identifies the chart as LOS (Uncertainty) (mm).
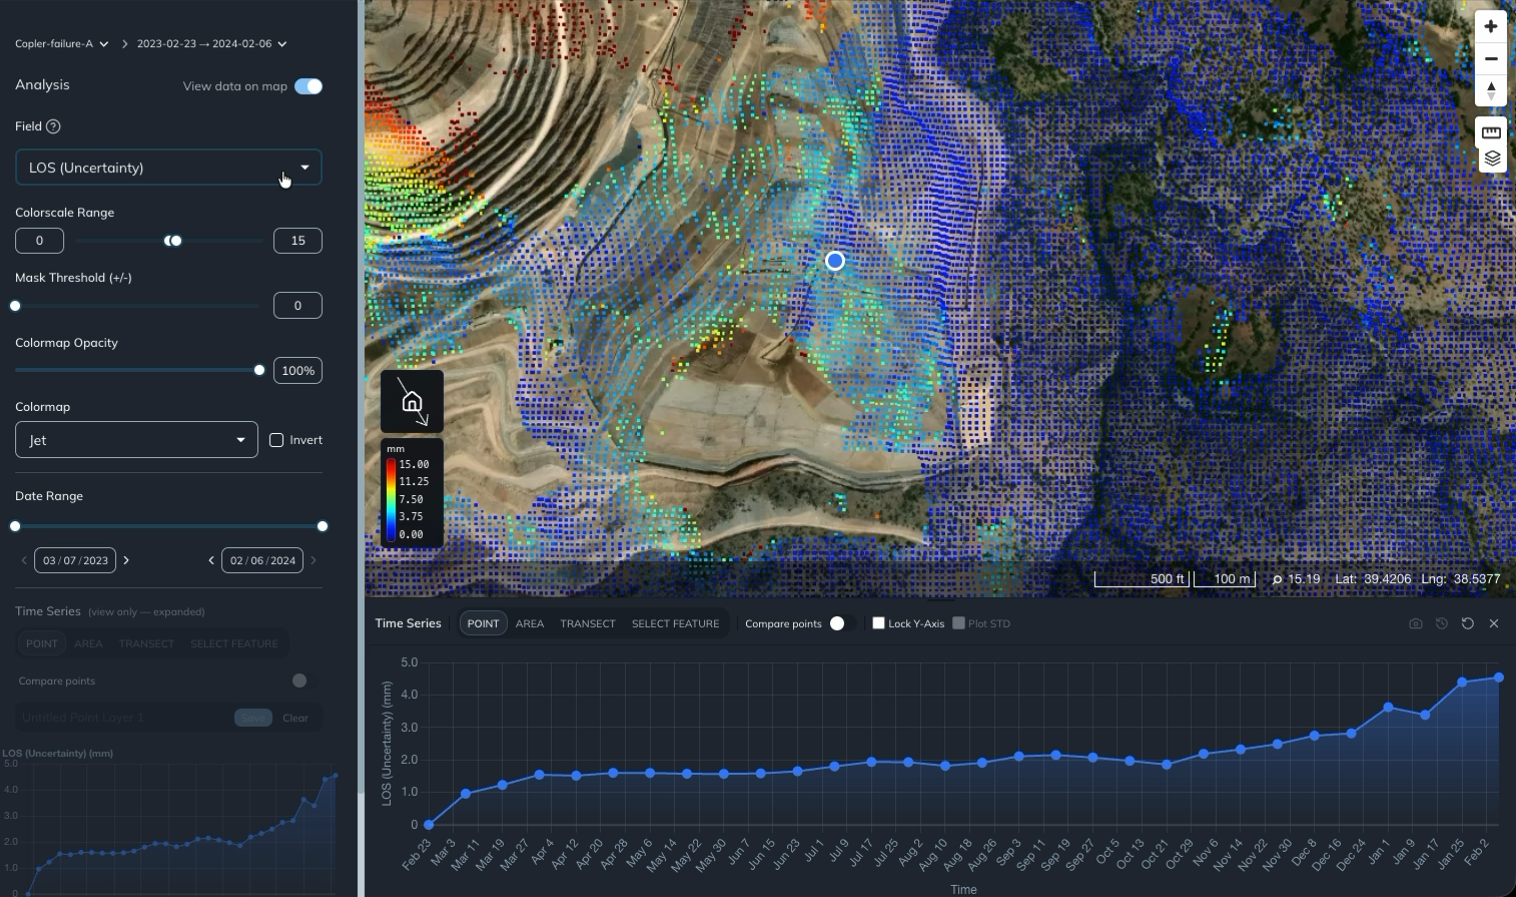
You can also show uncertainty as error bars on a deformation chart using Plot STD.
LOS Unfiltered🔗
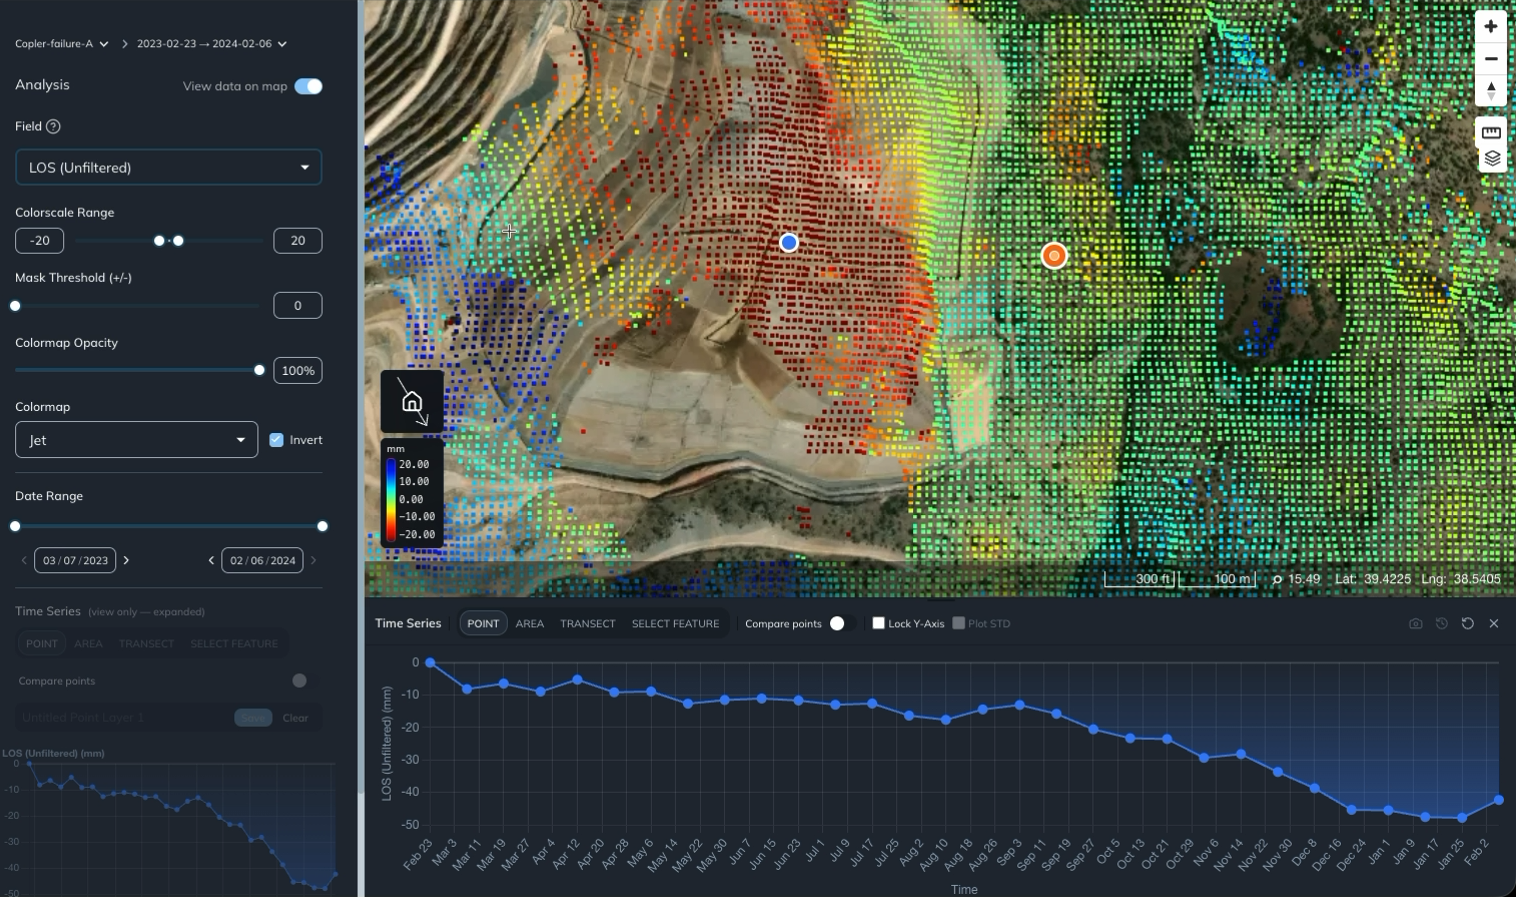
Select LOS (Unfiltered) to use an orange reference marker as the spatial reference for the data. Spatial filtering is not applied in this field. All displayed deformation is relative to the orange marker's location.
- Choose LOS (Unfiltered) from Field.
- Drag the orange marker to your reference location, such as a station known to have remained stable over the analysis period.
- Use POINT mode to select the location you want to inspect. Its time series shows movement relative to the orange reference point.
- Move the orange marker to change the reference location. Allow the map and chart to update.
The blue marker identifies the point you are inspecting; the orange marker sets the reference. Choose a reference near the area of interest with reliable data and known stability over the analysis window.
This field is useful for comparing movement with a stable station or examining the difference between adjacent moving and stable areas. The reference point's own movement affects all values measured relative to it. See Spatial Filtering in Iris for more guidance on reference selection.
Additional fields🔗
The Field dropdown also provides the following options when available for the analysis:
- LOS Velocity (180 days)
- LOS Acceleration (180 days)
- Coherence
- Estimated DEM Error
For background on velocity, acceleration, and coherence, see Data Layers in Iris.